Indeed as a proxy for Job Demand: The Impact of Covid-19 on New York City’s Job Market
Introduction
Just like the rest of America, New York City’s job market has been upended by Covid-19. In April of 2020, private sector jobs in New York City fell by 885,000, or 21.8%. However, Covid-19 also resulted in an increased demand for essential workers. With this in mind, I wanted to understand how the pandemic is affecting the job market, it’s impact on the different job sectors, and what companies are still hiring. To do this, I looked at Indeed job postings as a proxy for jobs in demand.
Data
I decided to look at daily indeed job postings disaggregated by sector and borough with the idea of using job postings as a proxy for job demand. This data is not available online in a clean format, therefore I had to scrape the data from Indeed. To do this, I used the rvest package.
Scraping
The goal was to extract the job title, company name, location, number of days since it had been posted, and the job category of every indeed job posting from the past 30 days. Using the number of days since it had been posted, I calculated a date for when the job was posted.
When it comes to scraping the data, the first step is to create a url for every borough & job category combination.
To do this, I got a list of all the job categories available on indeed (https://www.indeed.com/find-jobs.jsp). The following code does that (insert code for sectors)
library(rvest)
library(plyr)
library(dplyr)


## Create all URLS - for each categry and borough

sectors <- read_html("https://www.indeed.com/find-jobs.jsp")

sectors <- sectors %>% html_nodes("ul#categories") %>% html_nodes("li") %>% html_text() %>% data.frame()
Then I cleaned the categories and prepared them to be used as part of the url.
colnames(sectors) <- "sectors"
sectors$sectors <- as.character(sectors$sectors)
sectors_clean <- gsub("/","+",sectors$sectors) %>% data.frame()
colnames(sectors_clean) <- "sectors"
sectors_clean$sectors <- gsub(" ","+",sectors_clean$sectors)
sectors_clean$sectors <-  as.character(sectors_clean$sectors)
sectors_clean <- sectors_clean[-3,]
sectors_clean <- data.frame(sectors_clean)
After inspecting the urls, I realized that every borough has a unique code that is present in the url. For example, the url for the Accounting/Finance category in the bronx looks like this: https://www.indeed.com/jobs?q=Accounting+finance&l=New+York+State&radius=25&rbl=Bronx%2C+NY&jlid=609f72bcaf2fb185 The id number for each borough changes, and in this case we can see that the id number for the Bronx is 609f72bcaf2fb185. So I collected the id number for each borough.
After putting everything togethor, I included one last restriction at the end of the url (fromage=29). This filters out any job that is labeled as 30+ days ago. I did this because I want to track the number of daily postings, and if a posting is labeled as 30+ days ago then I do not know what day that posting was made available. The rest of the code looks like this:
Boroughs <- data.frame(boro=c("Bronx","Staten+Island","Queens","Manhattan","Brooklyn","New+York"), id=c("609f72bcaf2fb185","92f5613fae65555c", "a036f550dfd81ea4", "ea5405905f293f14", "e69692d64317994a", "45f6c4ded55c00bf"))

url_part1 <- sapply(1:26, function(x) paste("https://www.indeed.com/jobs?q=",sectors_clean$sectors[x],"&l=New+York+State&radius=25&rbl=", sep=""))

url_part2 <- unlist(lapply(1:6, function(x) paste(url_part1, as.character(Boroughs$boro)[x],"%2C+NY&jlid=", sep="")))

urls <- c(paste(url_part2[1:26],Boroughs$id[1],"&sort=date&fromage=29&filter=0", sep = ""), paste(url_part2[27:52],Boroughs$id[2],"&sort=date&fromage=29&filter=0", sep = ""), paste(url_part2[53:78],Boroughs$id[3],"&sort=date&fromage=29&filter=0", sep = ""), paste(url_part2[79:104],Boroughs$id[4],"&sort=date&fromage=29&filter=0", sep = ""), paste(url_part2[105:130],Boroughs$id[5],"&sort=date&fromage=29&filter=0", sep = ""), paste(url_part2[131:156],Boroughs$id[6],"&sort=date&fromage=29&filter=0", sep = ""))

urls <- urls %>% data.frame(stringsAsFactors=FALSE) %>% bind_cols(sectors=data.frame(rep(sectors_clean$sectors,6), stringsAsFactors=FALSE))
Ultimately, I created a loop that goes through every url and extracts the information I needed. This code can be found on my github.
Results
I managed to track the number of daily postings on Indeed between February 27, 2020 and May 21, 2020. During this time, a state of emergency was issued in NYC. To keep things standard, I matched the job categories from Indeed to the corresponding NAIC codes and began to visualize the data.

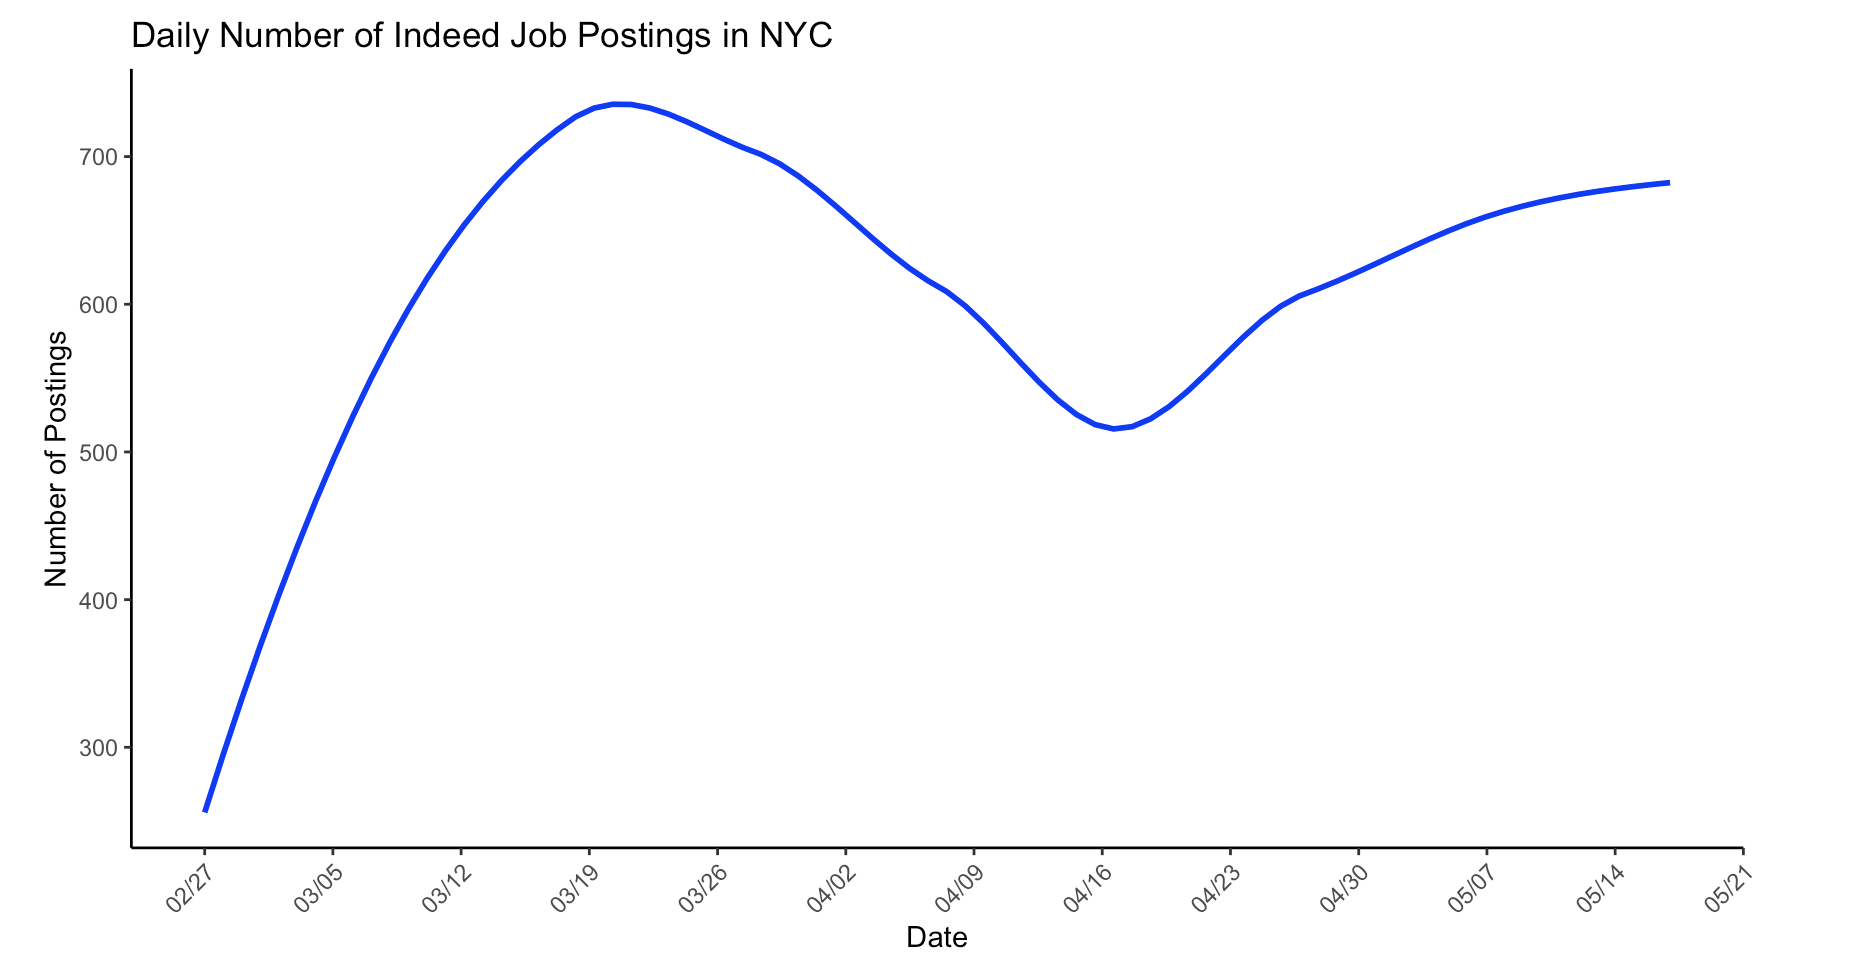
Trend line shows a decline in the number of daily job postings in NYC beginning the week of March 19, 2020, approximately a week after the state of emergency in NYC was issued. This decline continues until the week of April 16. Job postings start to increase again slowly after the week of April 16, 2020.

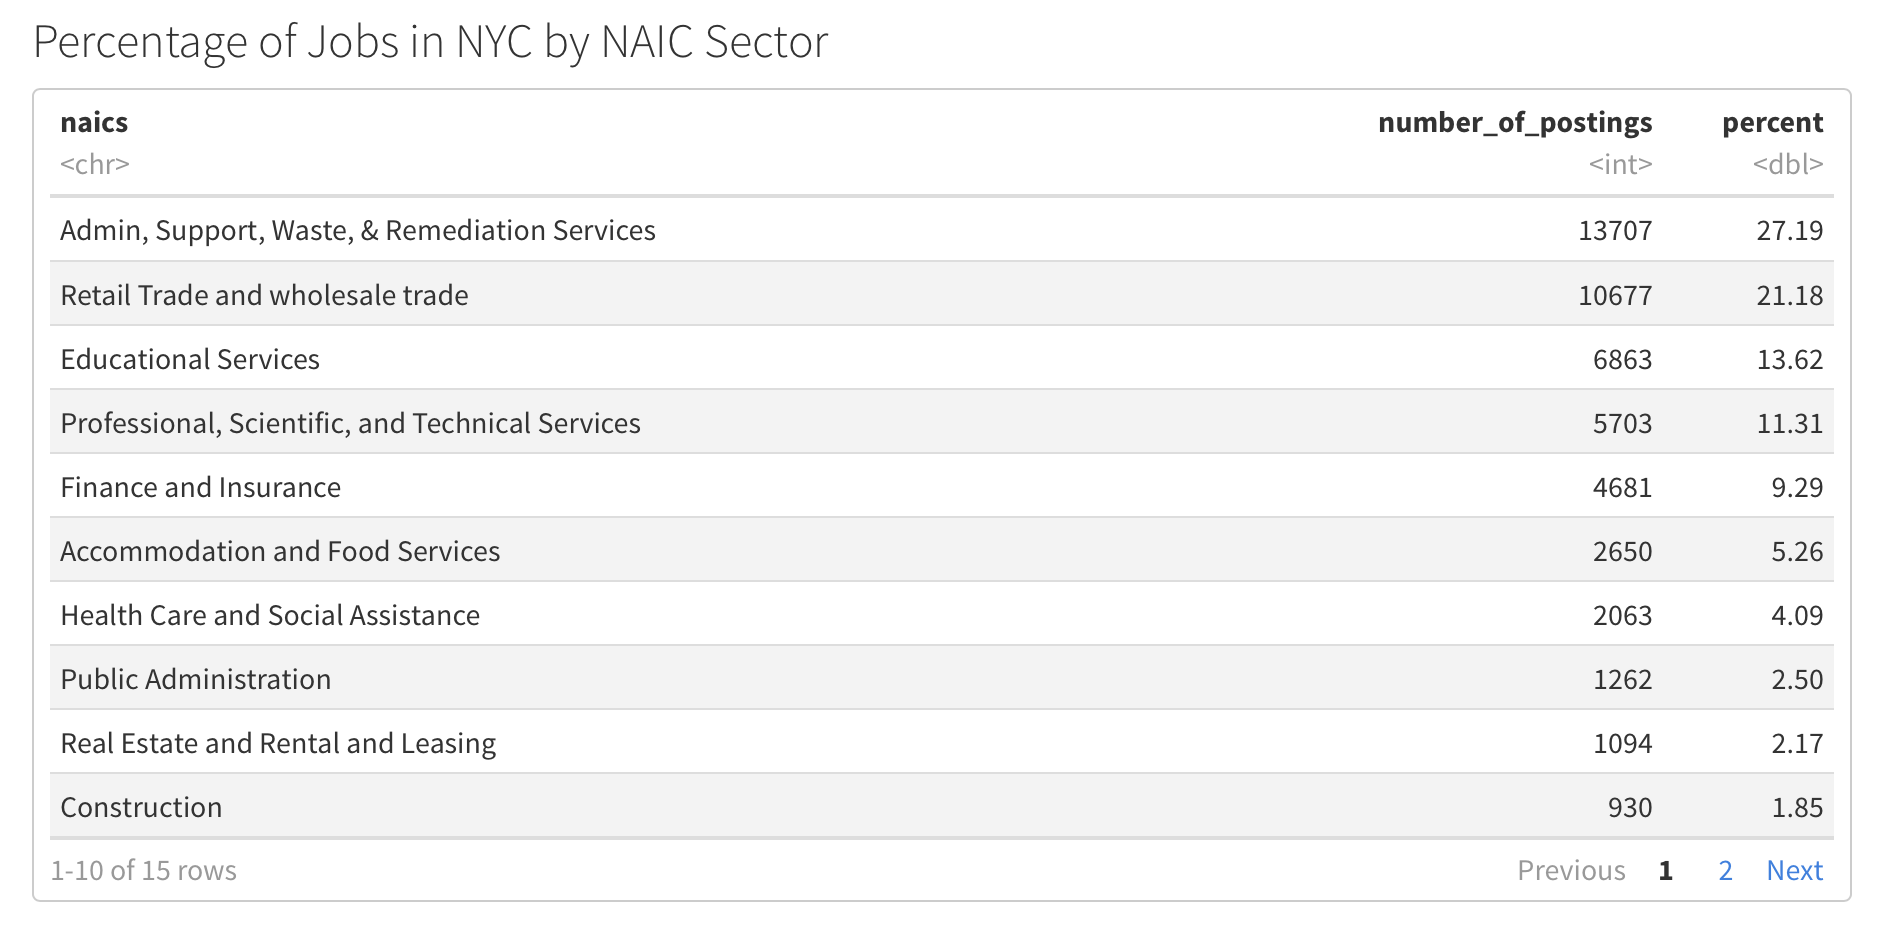
Administration, Support, Waste, and Remediation services make up 27.2% of the jobs posted on Indeed between February 27, 2020 and May 21, 2020. This is followed by the Retail Trade and wholesale trade sector with 21.18% of the job postings during that time period, and then educational services with 13.62%.

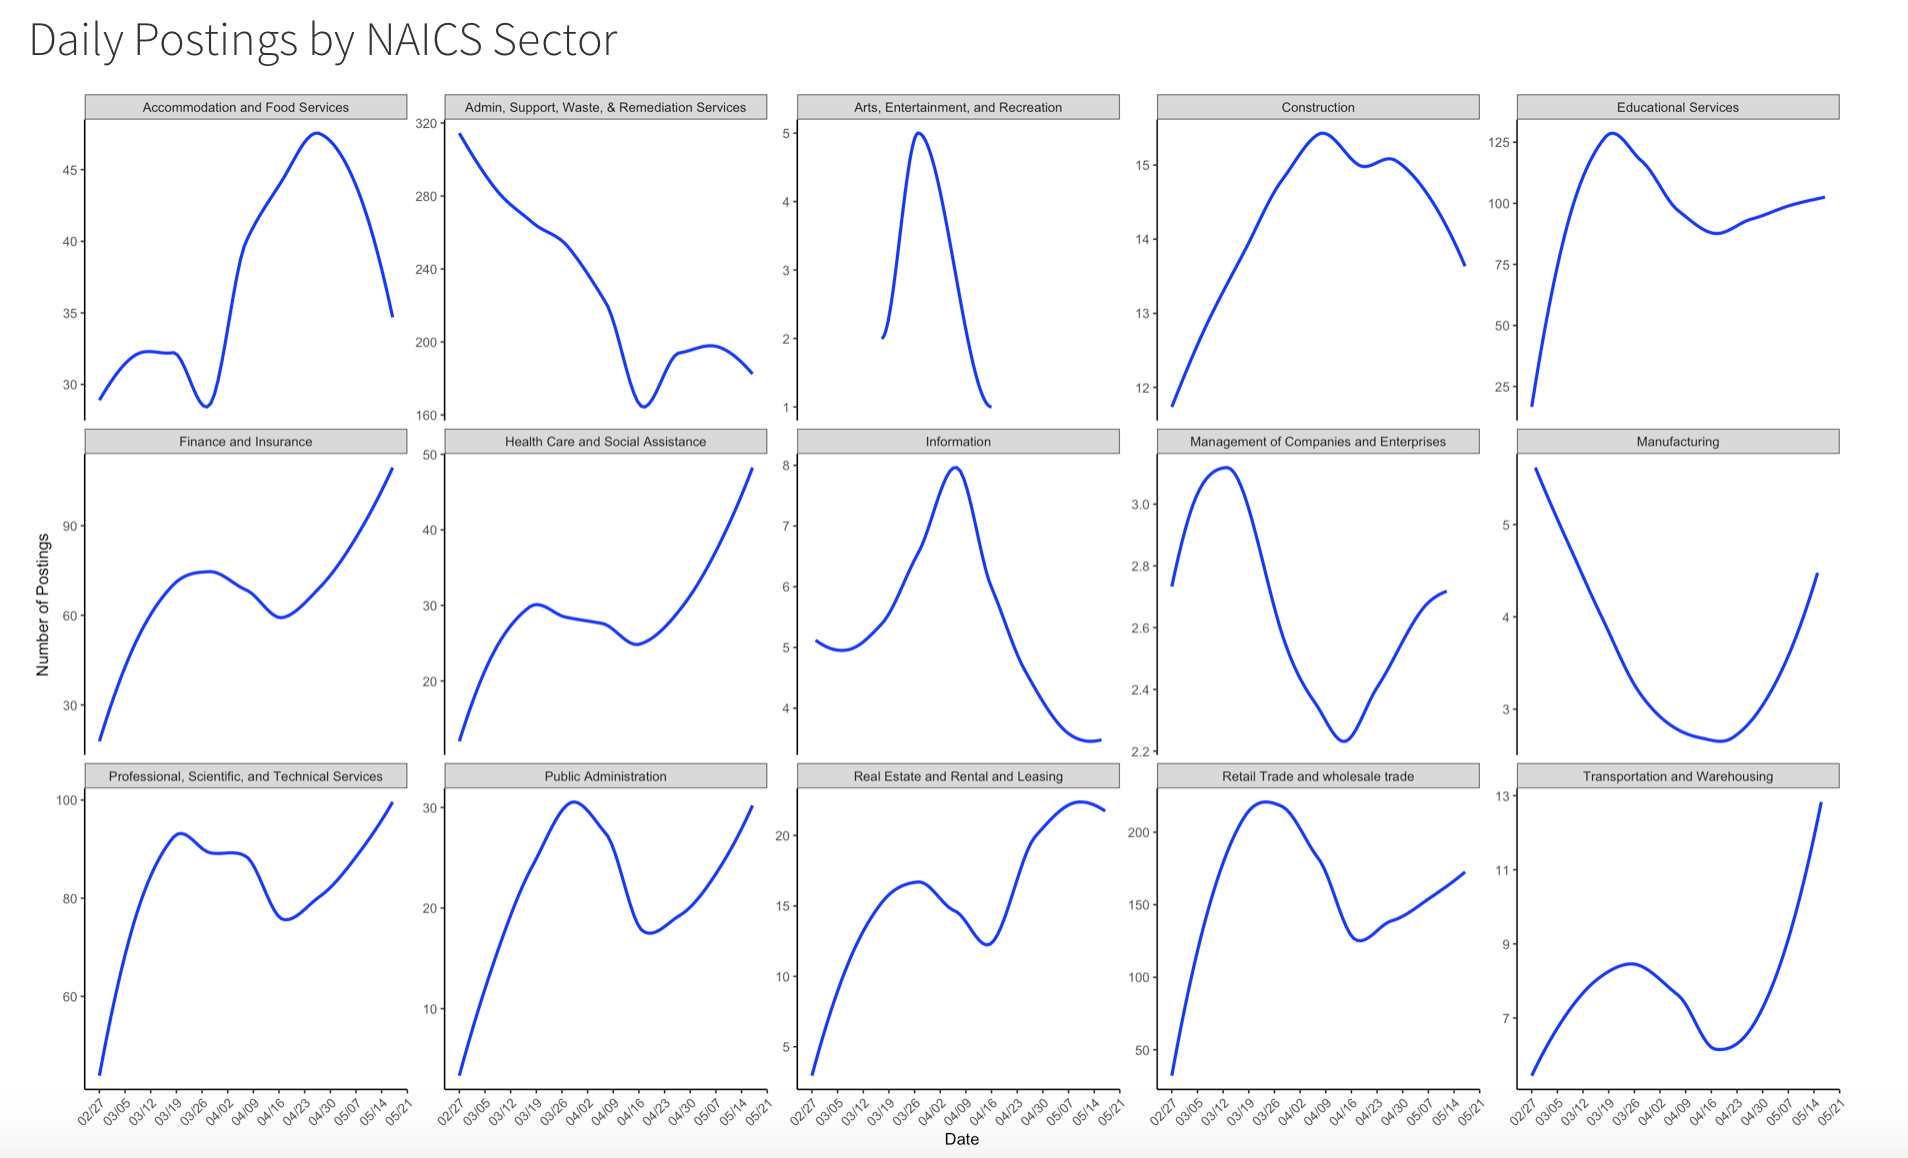
Overall, most sectors experienced a decrease in number of daily job postings beginning March 12, 2020. As expected, we see health care and social assistance job postings slightly drop after March 19, 2020, however job postings rapidly spiked up after April 16, 2020. Although Administration, Support, Waste, and Remediation service jobs made up apprimately 27.2% of all job postings during that time, job postings in that sector have been declining.
Takeaways
There is a decrease in the overall number of job postings in NYC correlating with the state of emergency that was issued. As expected, the healthcare and social assistance sectors quickly recovered and job postings spiked a couple of weeks after the state of emergency. Some other sectors that spiked as well are:
Some sectors that did not appear to recover quickly are:
