Exploring Associations Between Cortical Thickness and Subcortical Volume Measures Using Partial Least Squares Regression
Introduction
Experts agree that Alzheimer’s Disease is caused by abnormal buildup of beta-amyloid protein within the brain. The amyloid protein destroys brain cells and as Alzheimer’s progresses, both the cortical and hippocampus shrink and ventricles are enlarged. Understanding the progression of the brain deterioration and the correlations of deterioration between parts of the brain is a crucial part of identifying where there is room for possible remedy for patients. Brain atrophy, measured by MRI, and hypometabolism, measured by PET, are primary diagnostic biomarkers for Alzheimer’s disease. Currently, the field is moving towards multi-modal brain imaging. Rather than using data from only one medical measure, such as MRI, Multi-modal analysis incorporates data from different medical tools including MRI, FMRI, PET, WMHI, and others.
The goal of this project is to use data from the Alzheimer’s Disease Neuroimaging Initiative (ADNI) and the Reference Ability Neural Network (RANN) study to explore correlations between the subcortical volume and cortical thickness structures of the brain for both sets of participants. Both of these measures are T1 images that come from MRI. Ultimately, I hope to expand the analysis to incorporate other measures, ideally WMHI data.
Partial least squares regression was used to identify significant cortical thickness predictors of subcortical volume.
Data
The Alzheimer’s Disease Neuroimaging Initiative (ADNI) is a multisite study that aims to improve clinical trials for the prevention and treatment of Alzheimer’s disease. Many techniques were used to study the participants such as MRI scanning, PET scanning, and neuropsychological tests. The Reference Ability Neural Network (RANN) Study collected similar data on cognitively normal young and old patients. ADNI participants consist of people diagnosed with Alzheimer’s disease while RANN participants are healthy patients.
Methods
Partial least squares regression (plsr) optimizes the latent components describing the global correlation of the images treated as multi-dimensional arrays. Essentially, this enables the model to identify significant correlations between voxels in images of different modalities. The model allows for the user to choose the number of latent components that should be used. Part of my analysis includes calculating the optimal number of latent components to be used for the model based on mean squared error of the predictions (MSEP).
My approach is as follows:
- Bootstrap the data 100 times
- On each data set, run the plsr model using 1 through 10 latent components (i.e. run the model 10 times for each dataset) where subcortical volume is the outcome and cortical thickness is the predictor. This is multivariate analysis - there are 50 subcortical volume variables and 68 cortical thickness variables.
- Using 5-fold cross validation, calculate the MSEP for each model and choose the optimal number of components based on that with the smallest MSEP
- Using the model with the optimal number of components (i.e. smallest MSEP), calculate the average of the beta coefficients for each variable across the different datasets
- Calculate the z-score for each beta coefficient and identify any significant associations at an alpha level of 0.05.
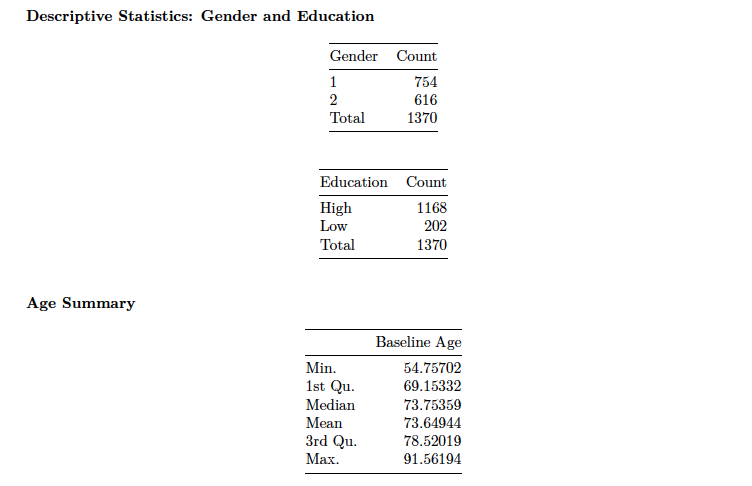
Summary Statistics for ADNI
Included are some summary statistics for the ADNI data:

Because these are patients with Alzheimer’s disease, then it is understood that they are primarily older (> 50).
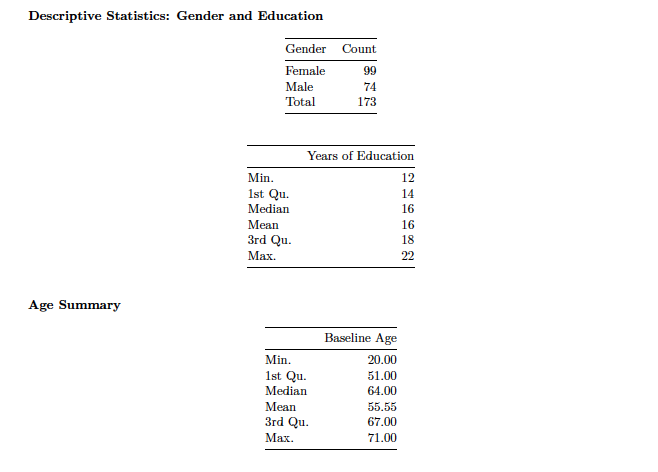
Summary Statistics for RANN
Included are some summary statistics for the RANN data:

Code
I created a function that takes in the following parameters:
- The set of outcome variables (y)
- The set of predictor variables (x)
- A list of the indices for each bootstrapped set (nums)
The function then calculates the optimal latent components and returns a list of the regression coefficients for each dataset.
plsr_opt_coef <- function(x,y,nums)
  {

j=1
l <- list()

for (i in 1:length(nums)) {

x_boot <- as.matrix(x[nums[[i]],])
y_boot <- as.matrix(y[nums[[i]],])

org_mod <- plsr(y_boot~x_boot, ncomp = 10, validation = "CV", segments = 5)

numcomps <- data.frame(sapply(1:10, function(x)(rowSums(data.frame(MSEP(org_mod, ncomp = x, intercept = FALSE)$val))/length(colnames(y)))[1]))
numcomps <- (cbind(c(1:10),numcomps))
names(numcomps) <- c("ncomp","Avg_MSEP")
min <- min(numcomps[,2])
opt_ncomps <- numcomps[numcomps$Avg_MSEP == min,][[1]]


coef_model <- coef(org_mod, ncomp = opt_ncomps)

l[[i]] <- coef_model
    j <- j + 1

}

list_opt_coefs <- l
assign("list_opt_coefs",list_opt_coefs,.GlobalEnv)

}


# Run plsr function
opt_coef_model <- plsr_opt_coef(CT_Set, SV_Set, resamples)
Results
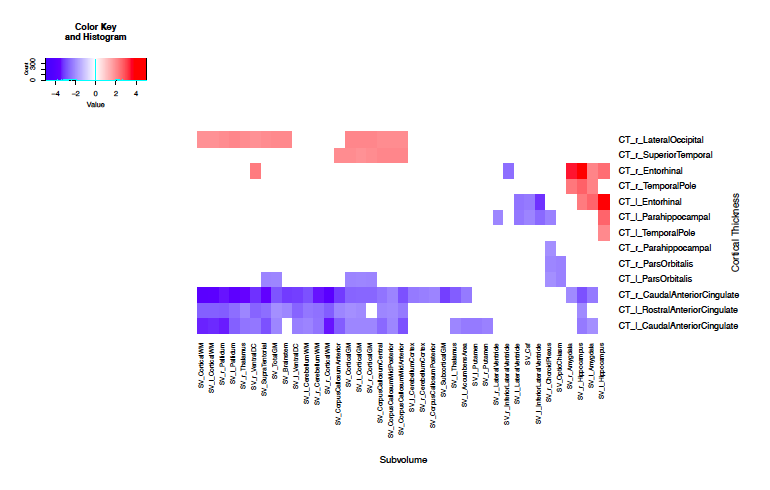
ADNI

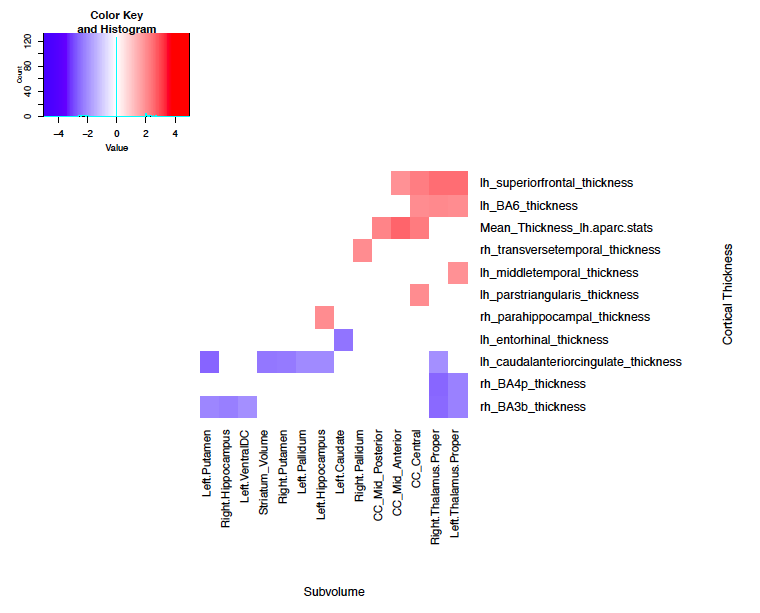
RANN

Summary
The ADNI subjects presented more correlations than the RANN subjects. It has been shown that among Alzheimer’s patients, both the entorhinal cortex and hippocampus simultaneously deteriorate. I was specifically looking for this correlation. There is an association between the entorhinal cortex and hippocampus among the ADNI patients, however this association is not present among the RANN patients, as was expected.
Further Research
Future research ideas to follow:
- Using sparse partial least squares regression on the data to compare the results – SPLSR takes into account sparse data/correlations.
- Asses the reproducibility/stability of correlations between datasets
- Identify not only single correlations but networks

