Clustering and Sentiment Analysis Using Spotify’s Valentine’s Day Playlist
The connotation for Valentine’s Day can differ depending on who you ask. Although it is meant to be a joyous day for lovers to express their affection, it can also be a sad holiday for those you have no one to share it with. So this year, I decided to analyze Spotify’s Valentine’s Day playlist with the goal of identifying which song is the saddest (i.e heart-break) love song and which song is the happiest (i.e. most romantic) love song. I achieved this by clustering the playlist into songs with low valence and low energy vs those with high valence and high energy and then filtering based on the percentage of sad words found in the lyrics.
Installing
The first step is to get access to Spotify’s API. Next, create a developer’s account to access the API here. For further instructions on setting up, you can visit the spotifyr website here.
To install and load the package in R, use the following:
devtools::install_github('charlie86/spotifyr')
library(spotifyr)
Data
There is a plethora of romantic songs that I could have used for this analysis. I did plenty of research on “Top Romantic Songs” & “Top Valentine’s Day Songs” prior to beginning, however I decided on Spotify’s own Valentine’s Day playlist which Spotify describes as “The most romantic tracks of all time featuring today’s hits and all the classics.” This playlist is made up of 90 songs.
Features
The Spoitfy API gives information on a songs danceability, energy, key, loudness, mode, speechiness, acousticness, instrumentalness, liveness, valence, and tempo. I saved the Valentine’s Day playlist as my own and then accessed it through the API. I then pulled out the tracks from the playlist and extracted the features.
This is the code used:
# Pull playlist
valentines_playlist <- playlists %>%  filter(playlist_name == "Valentine's Day Love")

# Get tracks
valentine_tracks <- get_playlist_tracks(valentines_playlist)

# Get features
track_features <- get_track_audio_features(valentine_tracks)
Lyrics
The API also has a fantastic function that allows you to connect with genius and extract lyrics for any given song. I used this function to retrieve the lyrics for all of the songs.
genius_lyrics(artist = , song = , info = "all")
However, in order for the lyrics to be found, there are some song titles that needed to be tweaked prior to using the function. For example, James Blunt’s song “You’re Beautiful” includes an apostrophe in the song title. When including the apostrophe in the song title, the genius function does not identify which song it is and returns an error. Therefore, I had to manually change some of the song titles. To identify which song title’s needed some editing, I created a function that returns the song lyrics if the song is found and NA if there is an error message, then I looped the function through my set of songs and created a list where each item is either the song lyrics or NA if the lyrics could not be found.
Code is as follows:
get_lyrics <- function(artist, name) {
  tryCatch({lrcs <- genius_lyrics(artist = artist, song = name, info = "simple")[1]}, error=function(e) {lrcs <<- NA})
  lrcs
}

lyrics <-list()
for (i in 1:90) {
  lyrics <- append(lyrics, get_lyrics(artists[i], song[i]))
}
I then identified where the NA’s are and fixed the corresponding song titles. After successfully acquiring all of the song lyrics and features, I prepared for my analysis.
Clustering
Spotify’s description for all of the available features can be found here.
Valence is defined as “a measure from 0.0 to 1.0 describing the musical positiveness conveyed by a track. Tracks with high valence sound more positive (e.g. happy, cheerful, euphoric), while tracks with low valence sound more negative (e.g. sad, depressed, angry)”.
Energy is defined as “a measure from 0.0 to 1.0 and represents a perceptual measure of intensity and activity. Typically, energetic tracks feel fast, loud, and noisy”.
Although it makes sense that sad songs would have low valence and low energy, it is important to keep in mind that there are many love songs that are romantic and happy yet are low in energy and valence (for example True Colors, both the Cyndi Lauper and Anna Kendrick versions). Therefore, I decided to cluster the songs into two groups based on their valence and energy. One cluster is made up of low valence and low energy while the other is high valence and high energy.
I used k-means clustering:
library(NbClust)
nc <- NbClust(Final_Dataset[,c(9,17)], min.nc=2, max.nc=15, method="kmeans")

# Plot valence vs energy
ggplot(Final_Dataset, aes(x = valence, y = energy, color = factor(clusters))) + geom_point()
The following ggplot shows the valence vs energy for each song:
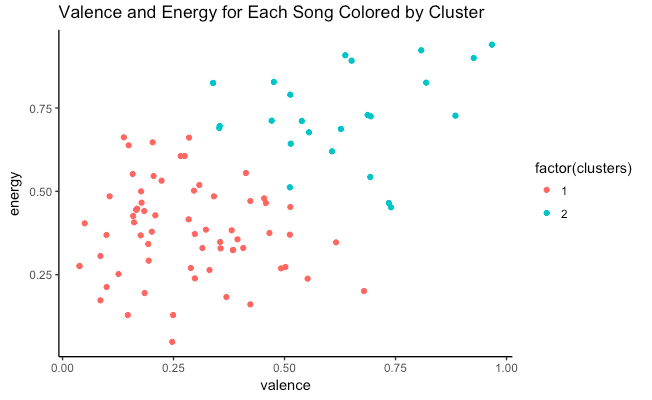
Cluster 1 is the low energy & low valence cluster while cluster 2 is the high energy and high valence cluster.
Cleaning the lyrics and identifying sad words
Next, I cleaned up the lyrics for each song by unnesting them and removing stop words.
library(tidytext)

# Unnest lyrics
lyric_tokens <- lyrics %>% unnest_tokens(word,lyric)

# Remove stop words
clean_lyrics <- lyric_tokens %>% anti_join(get_stopwords())
The unnest_tokens function separates the lyrics into a one word per line format. This is necessary in order to calculate the percentage of sad words per song.
Using the “nrc” lexicon that is available in the tidytext package, I calculated the amount of sad words and happy words in each song as follows:
# Extract nrc lexicon
nrcjoy <- get_sentiments("nrc") %>% filter(sentiment == "joy")
nrcsad <- get_sentiments("nrc") %>% filter(sentiment == "sadness")

total_words_per_song <- clean_lyrics %>% count(track_title) %>% rename(total_count = n)

total_happy_words_per_song <- clean_lyrics %>% inner_join(nrcjoy) %>% count(track_title) %>% rename(joy_count = n)

total_sad_words_per_song <- clean_lyrics %>% inner_join(nrcsad) %>% count(track_title) %>% rename(sad_count = n)
I then used the word count to calculate the percentage of happy and sad words per song.
Identifying the Songs
There are many different ways that I considered when it came to identifying the saddest love song. However, as previously mentioned, there are many beautiful, romantic songs that have low valence and low energy, and vice-versa for the happy songs. I decided to identify the happiest and saddest love songs within each cluster based on happy and sad word percentages. To identify the saddest song, I chose the one with the highest net score of sad_percent - joy_percent, and to identify the happiest song I chose the one with the highest joy-percent - sad_percent score.
These are the results:
Sad Songs
The top slow and sad songs are:
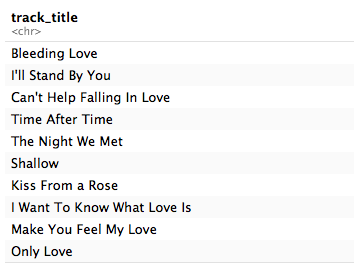
With the saddest song being Leona Lewis’ Bleeding Love.
Sentiment Analysis
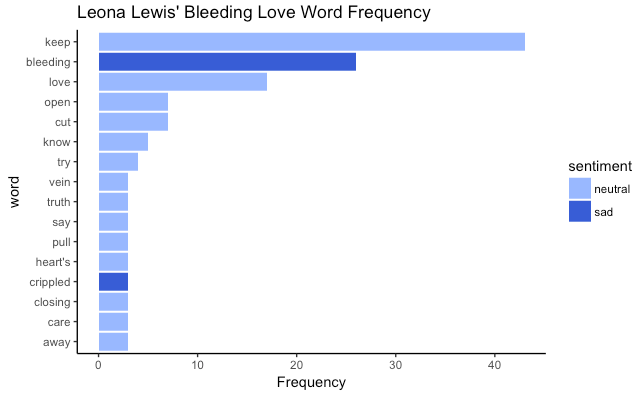
I went ahead and calculated the most frequently used words along with its sentiment for this song:
The top upbeat but sad songs are:
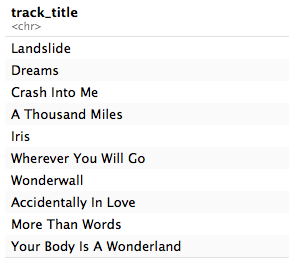
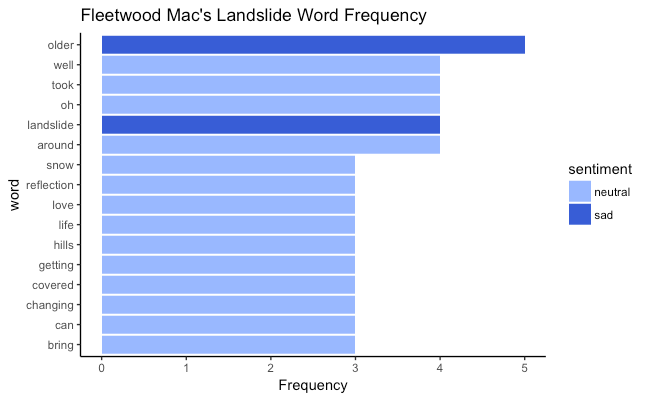
With the saddest upbeat song being Fleetwood Mac’s Landslide.
Sentiment Analysis
The most frequently used words along with its sentiment for this song:
Happy Songs
The top slow but romantic songs are:
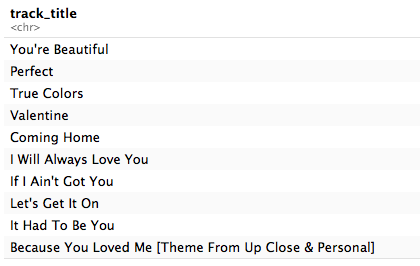
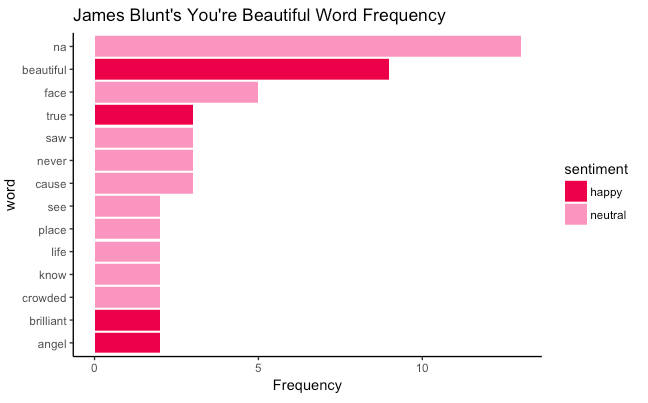
With the happiest slow song being James Blunt’s You’re Beautiful.
Sentiment Analysis
The most frequently used words along with its sentiment for this song:
The top upbeat and romantic songs are:
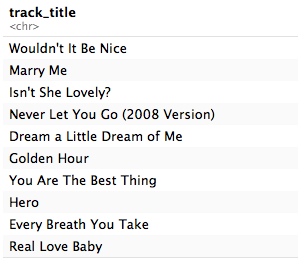
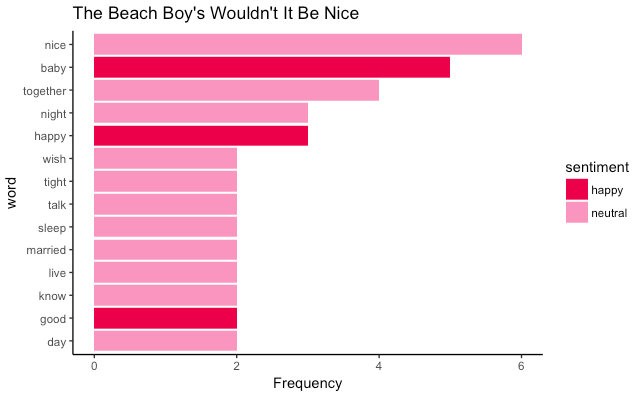
With the happiest upbeat song being The Beach Boys’ Wouldn’t It Be Nice?
Sentiment Analysis
The most frequently used words along with its sentiment for this song:
Conclusion
I was able to identify four different subtypes of love songs. The four subtypes are slow and sad, slow and romantic, upbeat yet sad, and upbeat and romantic. Overall, if you prefer slower songs like I do, then the most heart-breaking song for you would be Bleeding Love while the more romantic one would be You’re Beautiful. Meanwhile, if you prefer upbeat songs, the saddest love song would be Landslide and the more romantic song is Wouldn’t it be nice.
Spotify’s API is a great resource and there are many ways in which it can be used. I have linked a few other projects (from which I was inspired) that have used the API. It is also a great way to familiarize yourself with sentiment analysis.
If interested, make sure to check these out:
- Blue Christmas: A data-driven search for the most depressing Christmas song - Caitlin Hudon
- fitteR happieR - RCharlie

